EMI Part II
EMI Part II
EMI Part II
Redesigning the EMI website to improve user experience and user-friendliness, while adding new features.
Redesigning the EMI website to improve user experience and user-friendliness, while adding new features.
Redesigning the EMI website to improve user experience and user-friendliness, while adding new features.
Company
Company
Company
aCommerce
aCommerce
aCommerce
My Role
My Role
My Role
UX/UI Internship
UX/UI Internship
UX/UI Internship
Time Frame
Time Frame
Time Frame
Aug 2023 - Nov 2023
Aug 2023 - Nov 2023
Aug 2023 - Nov 2023
Project Overview
Project Overview
Project Overview
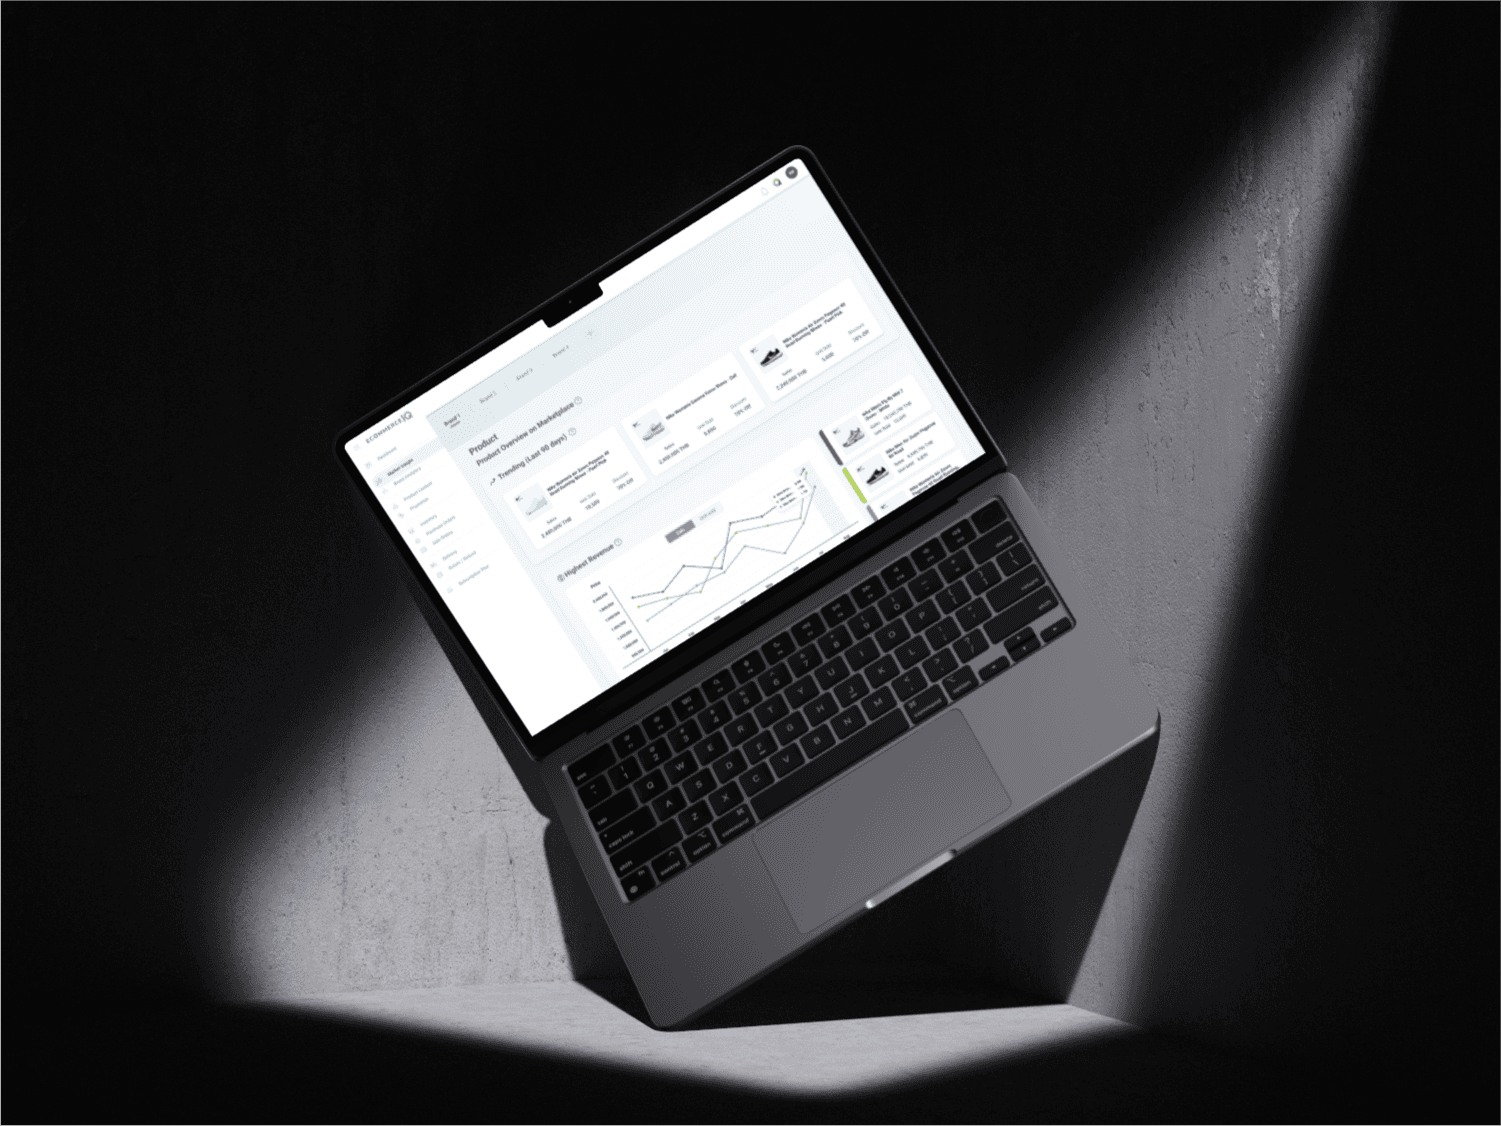
Welcome to Part II of EMI Redesign. In this part, I will take you to another EMI page that I have been assigned to redesign.
Another EMI website page is the Product page, which visualizes the data insights of each product in its category. The data show the revenues, the number of reviews, the top grey sellers, and a table of in-depth product analysis. This includes sentiment analysis from reviews, revenues, and the date range.
My Contribution
My Contribution
My Contribution
Currently, I redesigned 2 pages, including the market share and product page.
Moreover, I created a prototype of the market share page for preparing the usability testing.
Currently, I redesigned 2 pages, including the market share and product page.
Moreover, I created a prototype of the market share page for preparing the usability testing.
HOW DID IT ALL START
HOW DID IT ALL START
1
UNDERSTANDING
UNDERSTANDING
Problem Statement:
Problem Statement:
The current website displays only textual information including some unnecessary data insights.
Some data could not be displayed due to technical issues with the data scraping, which are not supported by the current design.
*Noted, I cannot show the current website because of confidentiality reasons.
2
SOLUTIONS
SOLUTIONS
Solutions:
Solutions:
Added the new features, which are:
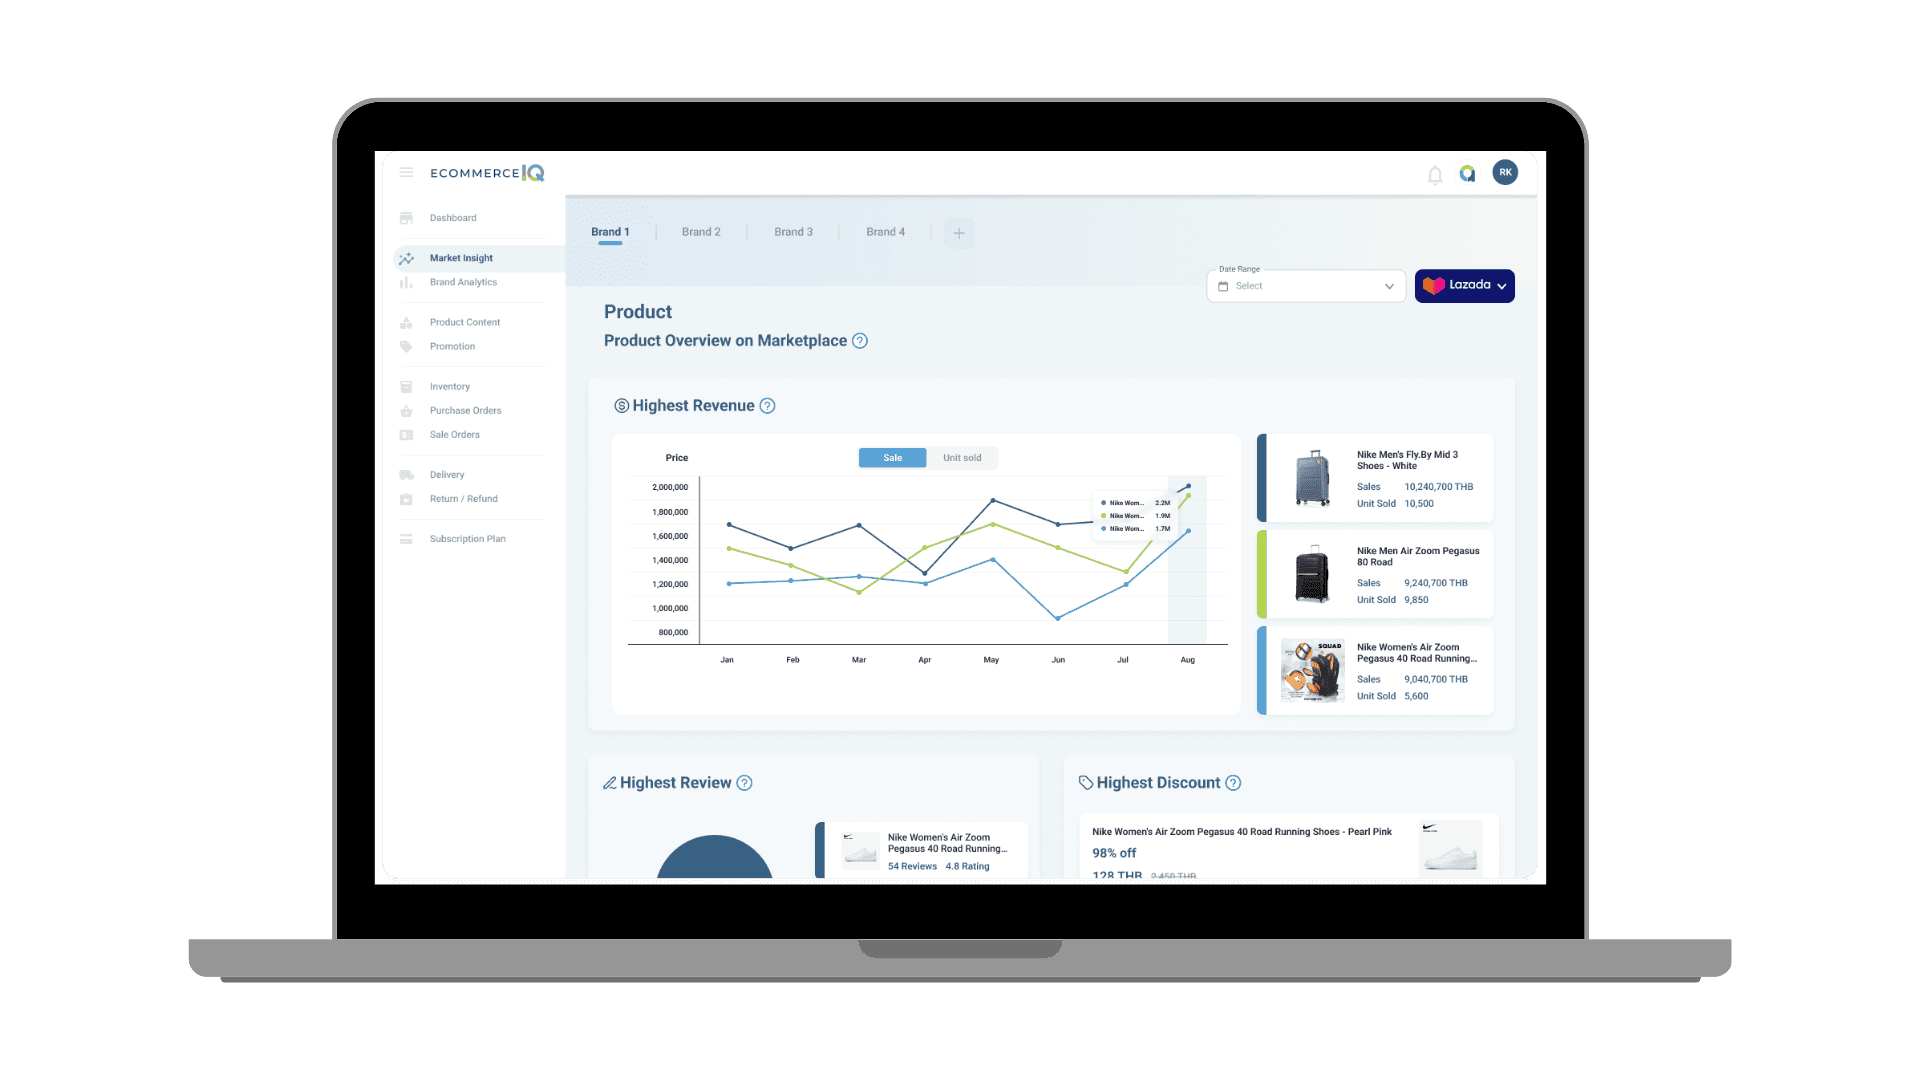
The highest revenue part: providing more information and visualizing revenue trends by the selected date range.
The highest reviewed part: Based on the current website, there is no visualization for sentiment analysis on the PLP page. Therefore, I designed a new layout and implemented it onto the PLP page to enhance engagement in this feature, while also providing information beyond just text.
The highest discount part: Identifying and displaying the product with the highest discount. Additionally, upon accessing the PDP page, the information will provide the revenue of each product and analyze trends.
The price composition: Providing a range of prices for each product based on their SKUs.
Added the new features, which are:
The highest revenue part: providing more information and visualizing revenue trends by the selected date range.
The highest reviewed part: Based on the current website, there is no visualization for sentiment analysis on the PLP page. Therefore, I designed a new layout and implemented it onto the PLP page to enhance engagement in this feature, while also providing information beyond just text.
The highest discount part: Identifying and displaying the product with the highest discount. Additionally, upon accessing the PDP page, the information will provide the revenue of each product and analyze trends.
The price composition: Providing a range of prices for each product based on their SKUs.
3
DESIGN
DESIGN
*This data is for illustrative purposes and is not real.
*This data is for illustrative purposes and is not real.
4
DELIVER
DELIVER
The most challenging part was redesigning the whole new page from textual information and adding the benefit features for customers, which my team and I had to brainstorm and conduct a lot of research to achieve this version. Regarding teamwork, all of them are experts and provided me with some advice on the UI aspect. Thank you to the EMI team for being super nice and kind, which makes us a great team.
The most challenging part was redesigning the whole new page from textual information and adding the benefit features for customers, which my team and I had to brainstorm and conduct a lot of research to achieve this version. Regarding teamwork, all of them are experts and provided me with some advice on the UI aspect. Thank you to the EMI team for being super nice and kind, which makes us a great team.